

Newsletter
TechAnV Blog
Get updates on security engineering, Rust, eBPF, and DevSecOps. No spam, unsubscribe anytime.
Check your inbox and click the confirmation link to complete your subscription.
Histogram with tooltips in Observable Plot#
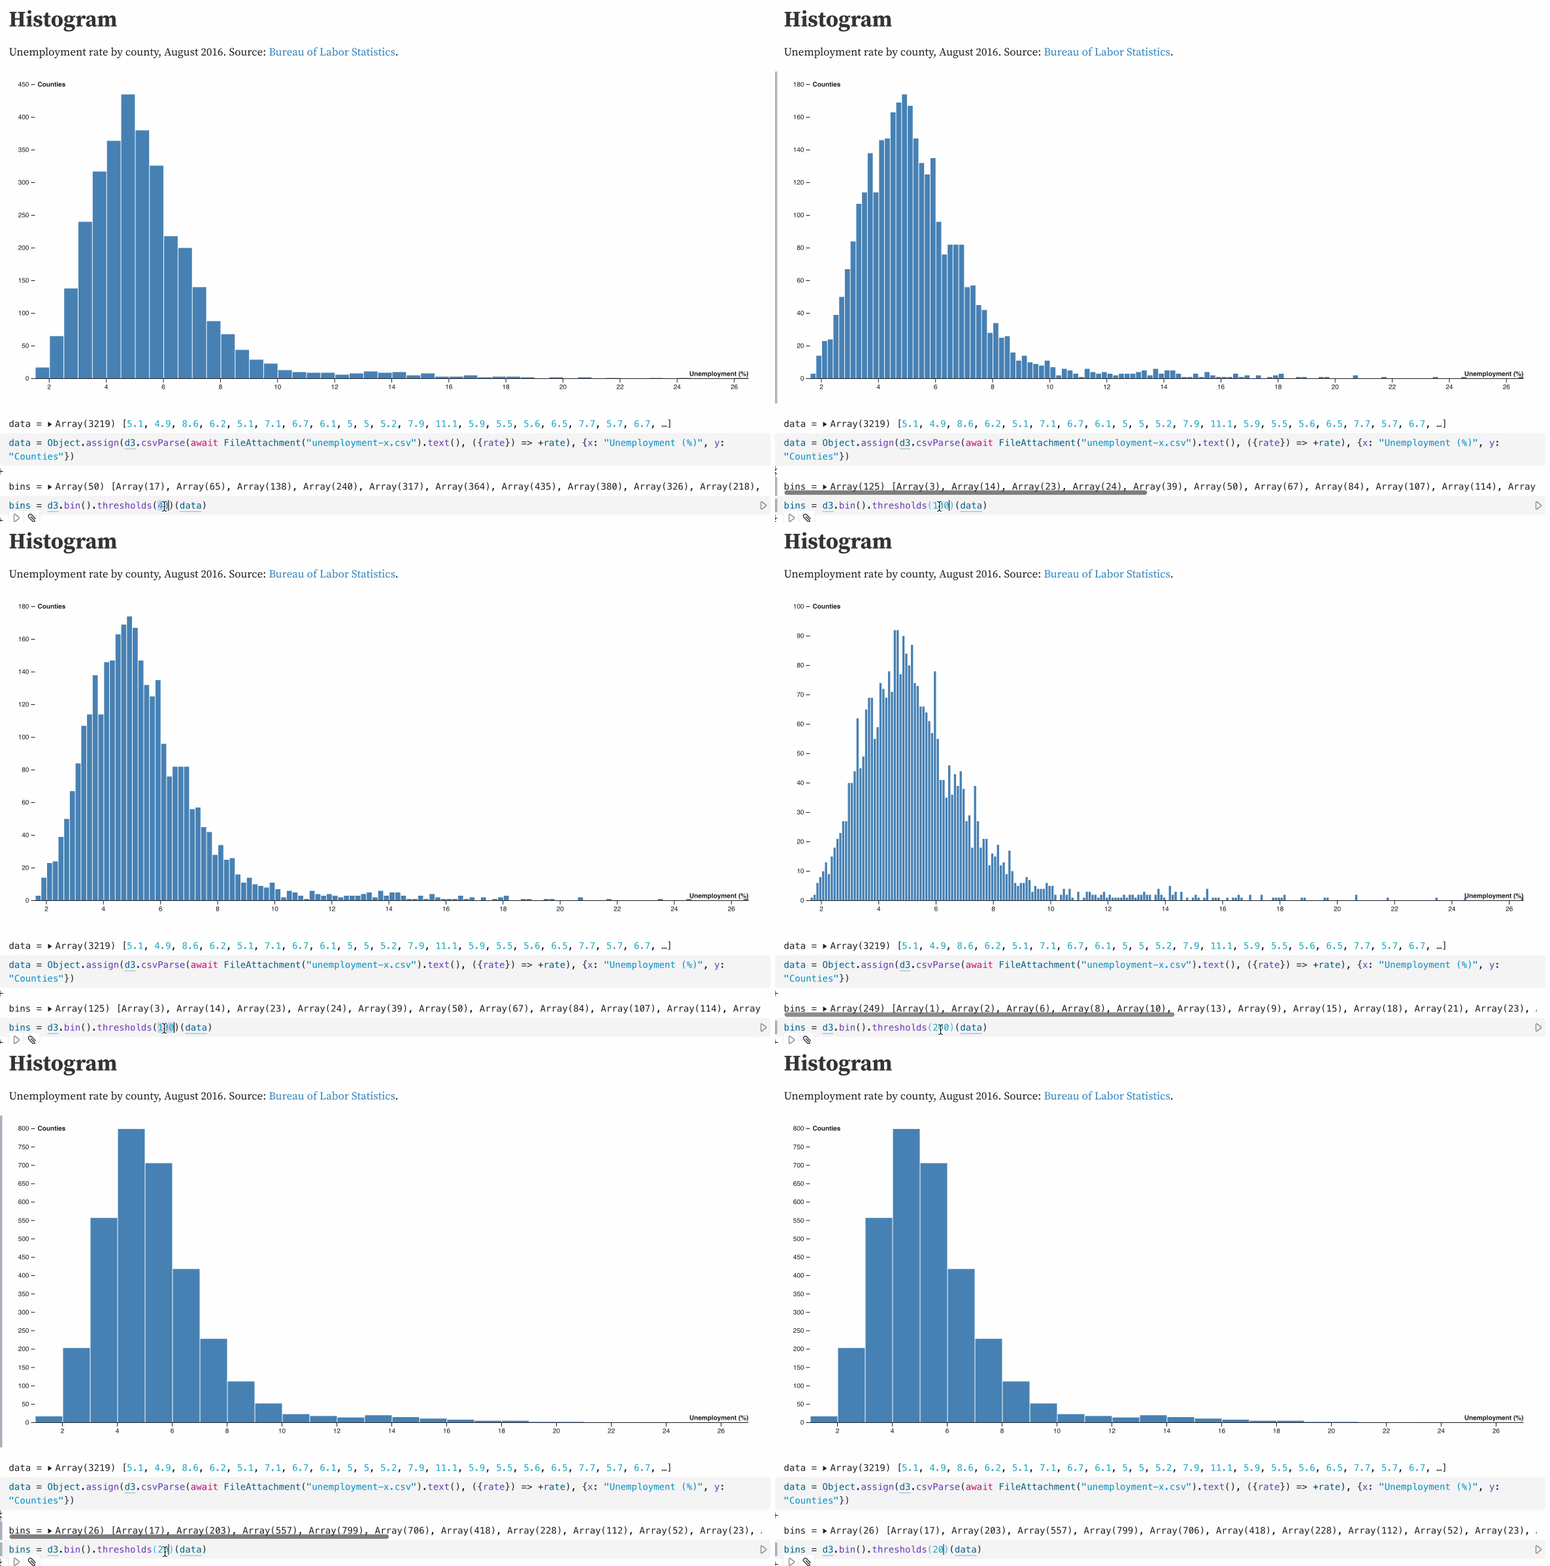
Given an array of datetime objects, I wanted to plot a histogram. But I wanted to automatically pick a bucket size for that histogram that resulted in something interesting, no matter what range of time the individual points covered.
I figured out that d3 has a mechanism for this: d3.bin().thresholds() (docs here). This defaults to using Sturges’ formula but has various other options.
This d3 Histogram notebook helped me figure this out:
Implementing this in Observable Plot#
The higher level Observable Plot library provides binning. Here’s the recipe I figured out for generating a histogram with that, in my Histogram of my tweets over time notebook:
1Plot.plot({2 y: {3 grid: true4 },5 marks: [Plot.rectY(tweets, Plot.binX({ y: "count" }, { x: "created_at" }))]6})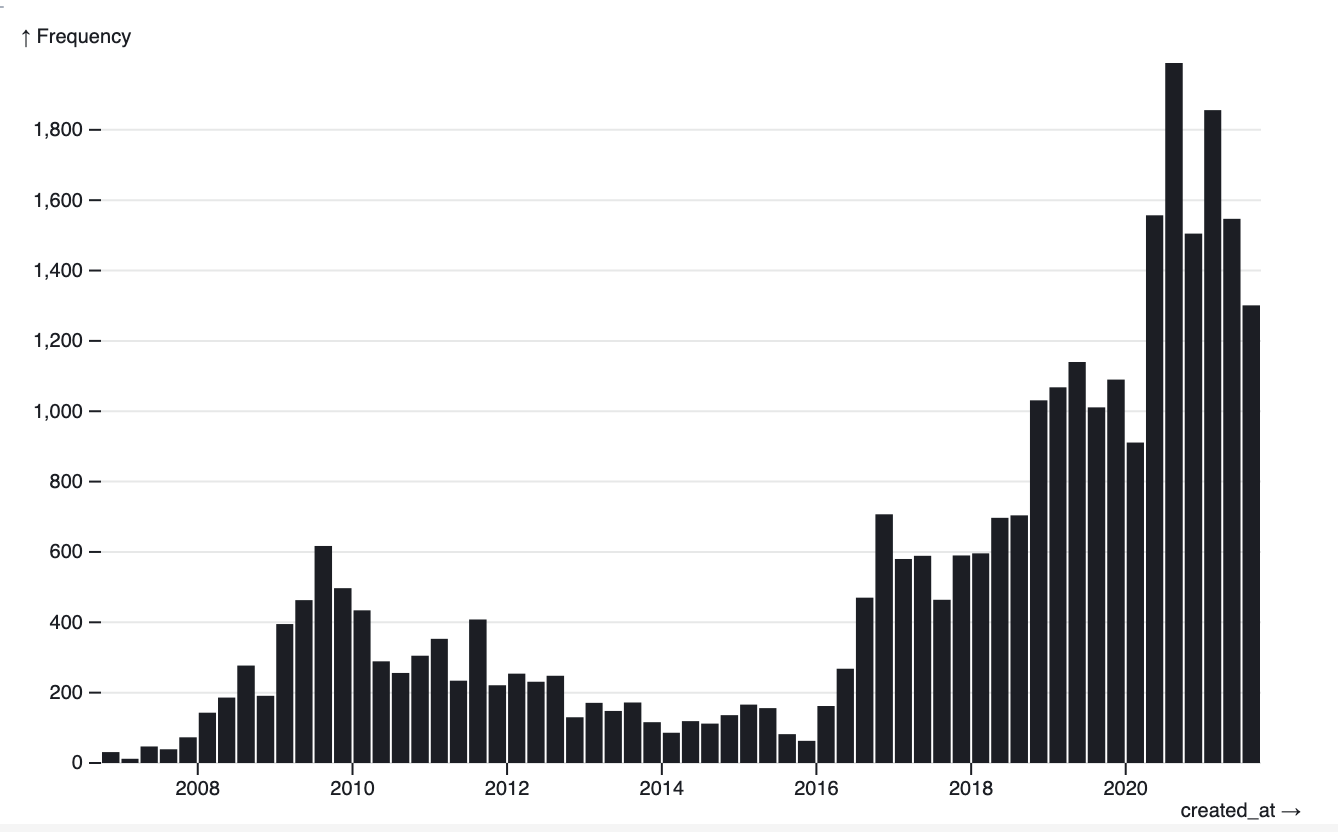
It turns out that while d3 uses Sturges’ formula Observable Plot instead uses Scott’s rule:
D3 chose Sturges’ formula because it was the popular choice (at the time) but Observable Plot defaults to Scott’s rule, with a max of 200 bins, which tends to perform better. Related: https://robjhyndman.com/papers/sturges.pdf
Mike Bostock - @mbostock
Adding tooltips#
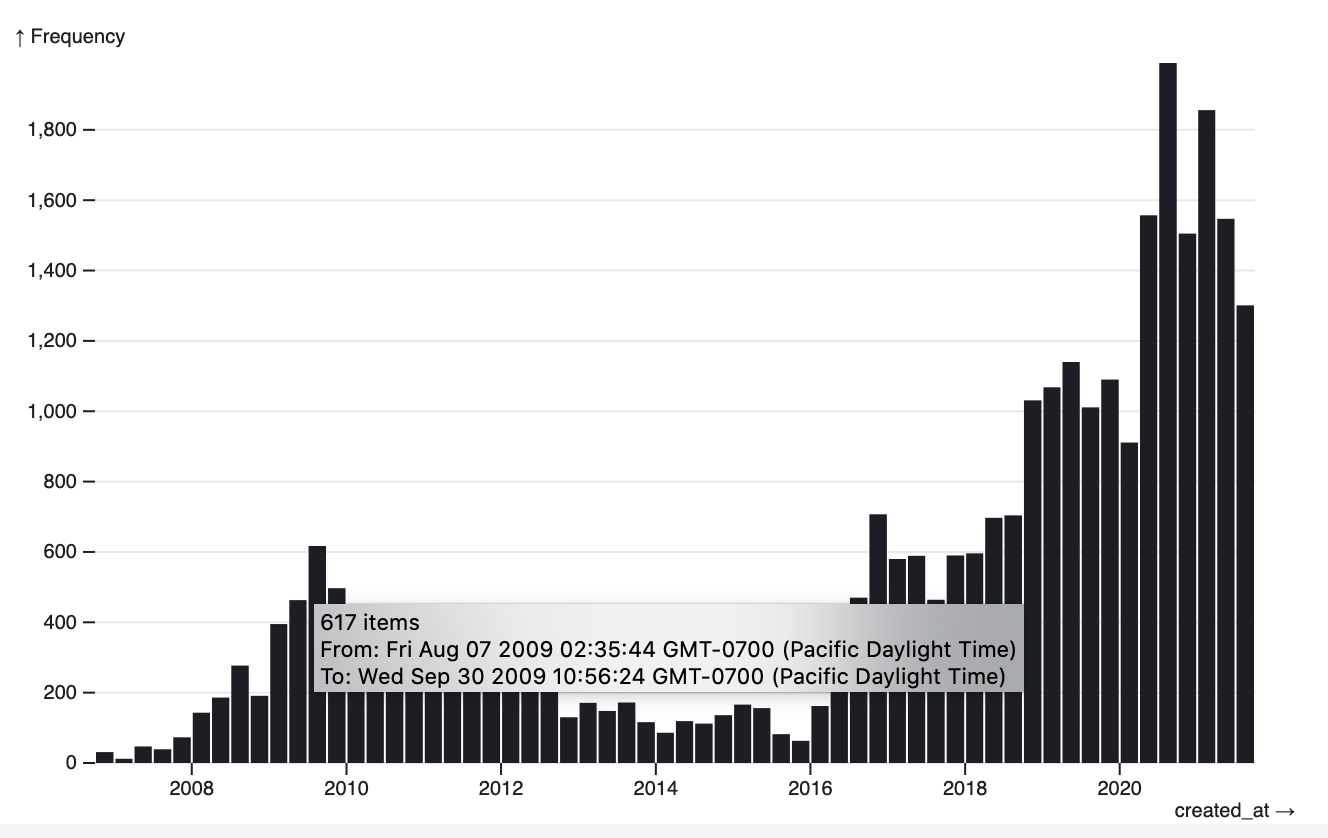
I wanted to add tooltips to the above chart. This was the hardest part to figure out - it turns out that second argument to .binX() can take a title option, which can be a function that accepts a bin array of items and returns a title.
UPDATE 27th January 2022: The below code example no longer works - the bin argument passed to the title: function used to be a list of items in that bin, but now appears to just be a single item.
This is what I ended up using:
1Plot.plot({2 y: {3 grid: true4 },5 marks: [6 Plot.rectY(7 tweets,8 Plot.binX(9 { y: "count" },10 {11 x: "created_at",12 title: bin => {13 let sorted = [...Array.from(bin).map(t => t.created_at)].sort();14 let min = sorted[0];15 let max = sorted.slice(-1)[0];16 let count = sorted.length;17 return `${sorted.length} item${18 sorted.length == 0 ? '' : 's'19 }\nFrom: ${min}\nTo: ${max}`;20 }21 }22 )23 )24 ]25})[...bin.map(t => t.created_at)].sort()is a recipe for creating a sorted copy of an array of valuesmax = sorted.slice(-1)[0]gets the last item in that array
Then I compose and return the string.
Here’s my Twitter thread where I figured this out.