
Using the Chrome DevTools console as a REPL for an Electron app#
I figured out how to use the Chrome DevTools to execute JavaScript interactively inside the Electron main process. I always like having a REPL for exploring APIs, and this means I can explore the Electron and Node.js APIs interactively.
https://www.electronjs.org/docs/tutorial/debugging-main-process#—inspectport says you need to run:
1electron --inspect=5858 your/appI start Electron by running npm start, so I modified my package.json to include this:
1 "scripts": {2 "start": "electron --inspect=5858 ."Then I ran npm start.
To connect the debugger, open Google Chrome and visit chrome://inspect/ - then click the “Open dedicated DevTools for Node” link.
In that window, select the “Connection” tab and add a connection to localhost:5858:

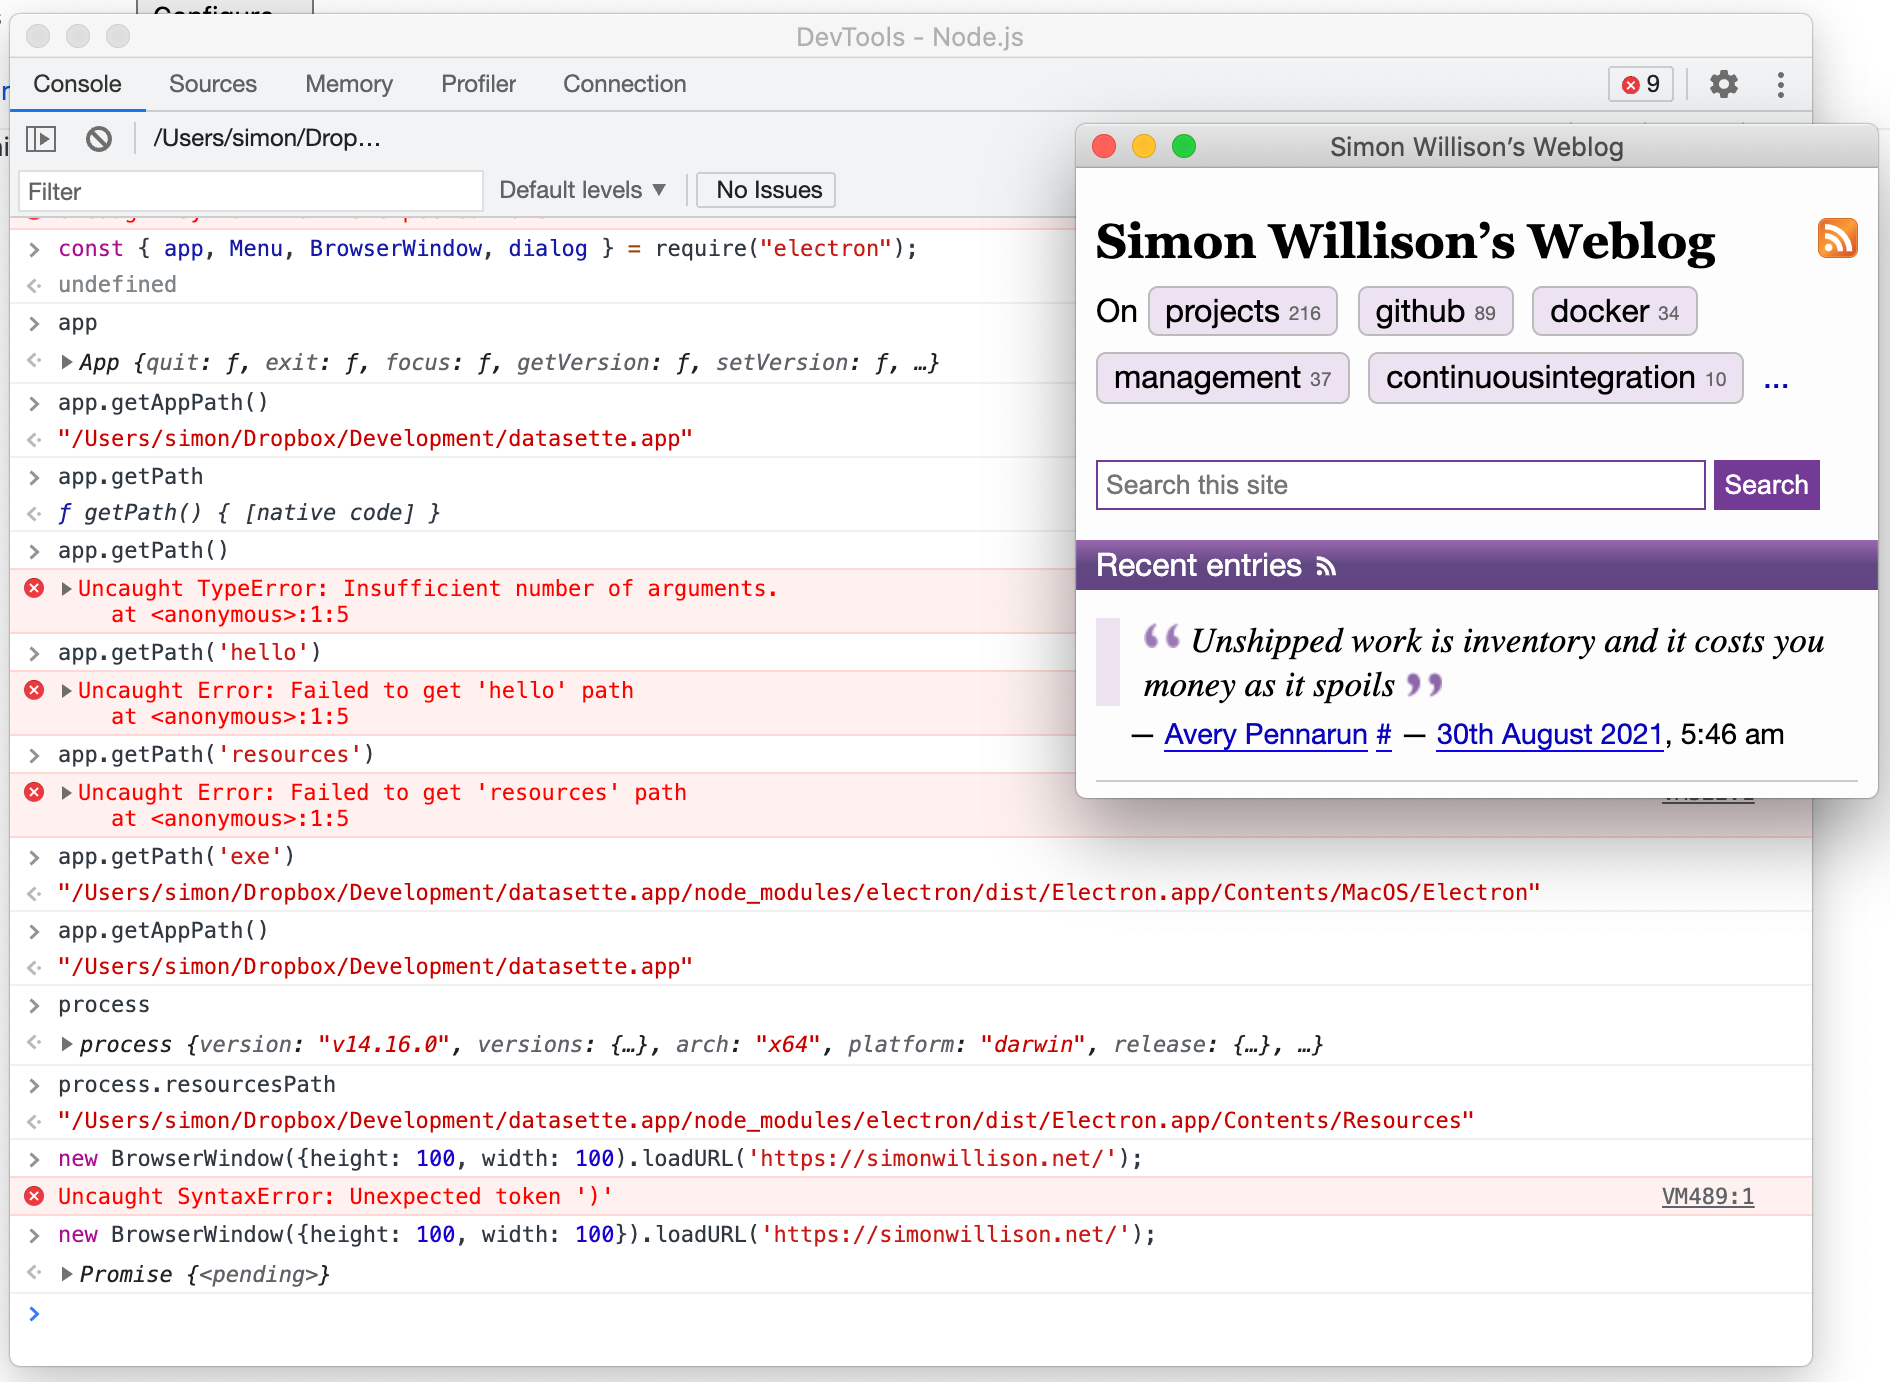
Switch back to the “Console” tab and you can start interacting with the Electron environment.
I tried this and it worked:
1const { app, Menu, BrowserWindow, dialog } = require("electron");2new BrowserWindow({height: 100, width: 100}).loadURL("https://simonwillison.net/");